How to Improve DORA Metrics as a Release Engineer

Ensuring efficient, reliable, high-quality software releases is crucial in software development. This is where release engineering comes into play. This blog will explore release engineering, its importance, and how release engineers can significantly influence key DevOps Research and Assessment (DORA) metrics.
What is Release Engineering?
Release engineering is a specialized discipline within software development focused on the processes and practices that ensure software is built, packaged, and delivered efficiently and reliably. It involves coordinating various aspects of software creation, from source code management to deployment.
A release engineer ensures that software releases are smooth and efficient, maintaining high standards of quality and reliability. They manage the build and deployment pipelines, automate repetitive tasks, and work closely with development, operations, and QA teams.
Key Components of Release Engineering
Version Control: Manage code changes using systems like Git and implement branching strategies.
Build Automation: Utilizing tools like Maven, Gradle, or Make to automate the build process alongside CI tools like Jenkins or GitHub Actions.
Artifact Management: Storing build artifacts in repositories such as JFrog Artifactory, Nexus, or AWS S3.
Testing: Implementing automated testing strategies, including unit, integration, and end-to-end tests.
Deployment Automation: Using CD tools like Spinnaker or ArgoCD to automate deployments, managed with IaC tools like Terraform or Ansible.
Configuration Management: Handling environment-specific configurations with tools like HashiCorp Consul or AWS Parameter Store.
Monitoring and Logging: Employing tools like Prometheus, Grafana, or the ELK Stack to monitor performance and centralized logging.
Importance of Release Engineering
Release engineering is crucial for:
- Ensuring efficient and reliable software releases – Streamlined processes reduce downtime and ensure consistent releases.
- Reducing human error through automation – Automation minimizes the risk of errors, ensuring more predictable outcomes.
- Enhancing collaboration – Bridging gaps between development, operations, and QA teams improves overall workflow.
- Quick Rollback and Recovery Mechanisms-Effective release engineering ensures that issues can be swiftly addressed and systems restored.
DORA Metrics
DORA (DevOps Research and Assessment) metrics are essential performance indicators used to check the effectiveness of software delivery and operational practices. They provide insights into the performance and health of DevOps processes.
Importance of DORA Metrics
DORA metrics are essential because they help organizations understand their software delivery performance, identify areas for improvement, and drive continuous improvement. They offer a data-driven approach to enhancing efficiency and reliability.
Key DORA Metrics
- Deployment Frequency: Deployment frequency measures how often new code is deployed to production. Higher frequency indicates a more agile and responsive development process.
- Lead Time for Changes: Lead time for changes measures the duration from when a code change is committed until it is deployed to production. Shorter lead times indicate a more efficient development pipeline.
- Change Failure Rate: The duration from a code commit to its successful deployment in production. Change failure rate indicates the percentage of deployments that lead to a failure in the production environment. Lower rates indicate more reliable releases.
- Mean Time to Recovery (MTTR): MTTR calculates the duration required to restore service following a failure. A lower MTTR signifies a more resilient and responsive system.
Real-world Implementation
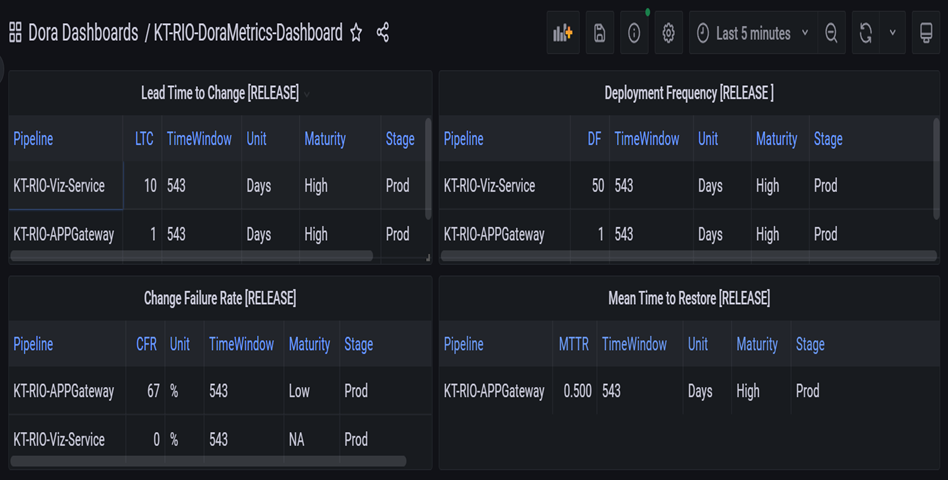
We will use a Powershell script to calculate the four critical metrics from Azure DevOps pipelines. The computed result will be stored in a Log Analytics Workspace. We will use Grafana as the data visualization tool to plot the Dashboard.
Below is the sample dashboard we can see after adding Azure data sources in Grafana. Snippets from the PowerShell scripts used to compute each metric are also below.
The complete code can be found at:
https://github.com/rajputrishabh/DORA-Metrics
Calculating Mean Time to Recovery
To calculate MTTR, sum up the time taken to recover from all incidents over time and divide by the number of incidents.
MTTR = Total downtime / Number of incidents
#calculate MTTR per day
  if($maintainencetime -eq 0){
    $maintainencetime=1
  }
  if($failureCount -gt 0 -and $noofdays -gt 0){
    $MeanTimetoRestore=($maintainencetime/$failureCount)
  }
  $dailyDeployment=1
  $hourlyrestoration=(1/24)
  $weeklyDeployment=(1/7)

  #calculate Maturity
  $rating=""

  if($MeanTimeToRestore -eq 0){
  $rating=" NA"
  }
  elseif($MeanTimeToRestore -lt $hourlyrestoration){
    $rating="Elite"
  }
  elseif($MeanTimeToRestore -lt $dailyDeployment){
    $rating="High"
  }
  elseif($MeanTimeToRestore -lt $weeklyDeployment){
    $rating ="Medium"
  }
  elseif($MeanTimeToRestore -ge $weeklyDeployment){
  $rating="Low"
  }
  if($failureCount -gt 0 -and $noofdays -gt 0){
    Write-Output "Mean Time to Restore of $($pipelinename) for $($stgname) for release id $($relid)
 over last $($noofdays) days, is $($displaymetric) $($displayunit), with DORA rating of '$rating'"
  }
  else{
    Write-Output "Mean Time to Restore of $($pipelinename) for $($stgname) for release id $($relid)
 over last $($noofdays) days ,is $($displaymetric) $($displayunit), with DORA rating of '$rating'"
}
Calculating Deployment Frequency
Count the number of deployments to production over a specific period to calculate deployment frequency.
| Deployment Frequency = Number of deployments / Time period |
#calculate DF per day
  $deploymentsperday=0
  if($releasetotal -gt 0 -and $noofdays -gt 0){
  $deploymentsperday=$timedifference/$releasetotal
  }

  $dailyDeployment=1
  $weeklyDeployment=(1/7)
  $monthlyDeployment=(1/30)
  $everysixmonthDeployment=(1/(6*30))
  $yearlyDeployment=(1/365)

  #calculate Maturity
  $rating=""
  if($deploymentsperday -eq 0){
    $rating=" NA"
  }
  elseif($deploymentsperday -lt $dailyDeployment){
    $rating="Elite"
  }
  elseif($deploymentsperday -ge $dailyDeployment -and  $deploymentsperday -gt
 $weeklyDeployment){
    $rating="High"
  }
  elseif($deploymentsperday -ge $weeklyDeployment -and $deploymentsperday -gt
 $monthlyDeployment){
      $rating ="Medium"
  }
  elseif($deploymentsperday -ge $monthlyDeployment -and  $deploymentsperday -ge
 $everysixmonthDeployment){
      $rating="Low"
  }
  if($releasetotal -gt 0 -and $noofdays -gt 0){
    Write-Output "Deployment frequency of $($pipelinename) for $($stgname)  for release id $($relid)
 over last $($noofdays)  days, is $($displaymetric) $($displayunit), with DORA rating of  '$rating'"
  }
  else{
    Write-Output "Deployment frequency of $($pipelinename)  for $($stgname)  for release id $($relid)
 over last $($noofdays)  days, is $($displaymetric) $($displayunit), with DORA rating of '$rating'"
  }
Calculating Change Failure Rate
To calculate the change failure rate, divide the number of failed deployments by the total number of deployments and multiply by 100 to get a percentage.
| Change Failure Rate (%) = (Failed deployments / Total deployments) * 100 |
The PowerShell script to calculate CFR is in the repository linked above.
Calculating Lead Times for Changes
To calculate the lead time for changes, measure the time from code commit to deployment for each change and calculate the average.
Lead Time for Changes = Sum of (Deployment time – Commit time) / Number of changes
The PowerShell script to calculate LTC can be found in the repository linked above.
How Release Engineers Can Influence DORA Metrics
Release engineers play a pivotal role in shaping and improving key DORA metrics, which are crucial for assessing the efficiency and reliability of software delivery. Below, we delve into practical strategies with real-world examples from companies like Etsy, Google, Netflix, and Amazon to illustrate how release engineers can positively impact Deployment Frequency, Change Failure Rate, Lead Time for Changes, and Mean Time to Recovery.
Improving Deployment Frequency – Etsy
Example: Implementing CI/CD Pipelines at Etsy
Strategy: To enhance deployment frequency, Etsy adopted continuous integration and continuous deployment (CI/CD) practices and several tools, such as Try and Deployinator.
Implementation
Automation: They automated their build, test, and deployment processes using Jenkins and custom scripts, enabling multiple daily deployments.
Feature Toggles: Introduced feature toggles to safely deploy incomplete features without affecting end users.
Outcome
Etsy achieved the capability to deploy code changes to production around 50 times a day, significantly increasing their deployment frequency.
Reducing Change Failure Rate – Google
Example: Comprehensive Testing at Google
Strategy: Google emphasizes comprehensive automated testing to reduce the change failure rate.
Implementation
Testing: Google integrated unit tests, integration tests, and end-to-end tests into its CI pipeline. It uses tools like GoogleTest and Selenium for various levels of testing.
Code Reviews: Established a rigorous code review process where peers review each change before it is merged, ensuring high code quality.
Outcome
By catching issues early in the development process, Google reduced the number of failed deployments, lowering their change failure rate.
Shortening Lead Time for Changes – Netflix
Example: Streamlined Build Process at Netflix
Strategy: Netflix optimized its build and deployment processes to shorten the lead time for changes.
Implementation
Optimized Pipelines: Netflix used Spinnaker, an open-source multi-cloud continuous delivery platform, to streamline their deployment pipelines.
Microservices Architecture: Adopted a microservices architecture, which allowed smaller, more manageable changes to be deployed independently.
Outcome
Netflix reduced its lead time for changes from days to minutes, allowing for rapid iteration and deployment.
Reducing Mean Time to Recovery (MTTR) – Amazon
Example: Robust Monitoring and Quick Rollback at Amazon
Strategy: Amazon focuses on robust monitoring and quick rollback mechanisms to minimize MTTR.
Implementation
Monitoring: Extensive monitoring was implemented using AWS CloudWatch, enabling proactive detection of issues.
Rollback Mechanisms: Developed automated rollback procedures using AWS Lambda functions and CloudFormation scripts to revert to a previous stable state quickly.
Outcome
Amazon reduced their MTTR significantly, ensuring quick recovery from incidents and maintaining high service availability.
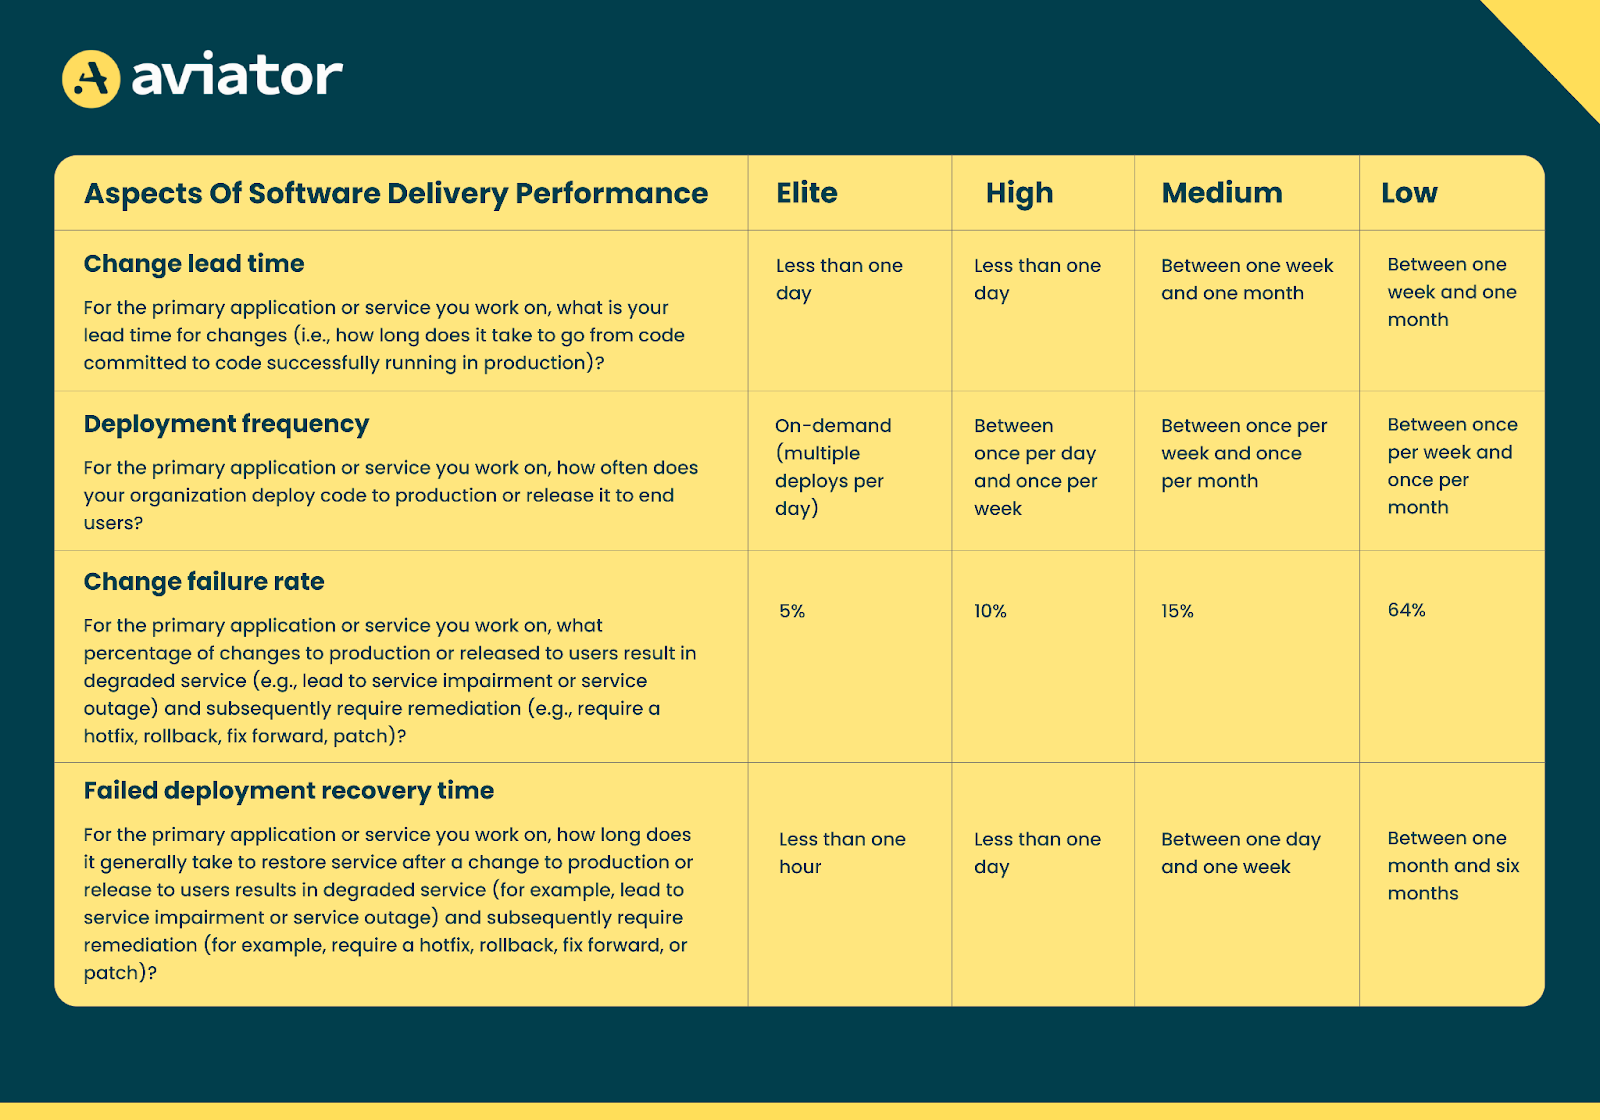
Deployment Frequency and Lead Time for Changes evaluate the speed of delivery, whereas Change Failure Rate and Time to Restore Service evaluate stability. By tracking and continuously improving these metrics, teams can achieve significantly better business results. Based on these metrics, DORA categorizes teams into Elite, High, Medium, and Low performers, finding that Elite teams are twice as likely to achieve or surpass their organizational performance goals.
Pitfalls of DORA Metrics for Release Engineers
While DORA metrics provide valuable insights into software delivery performance and operational practices, they come with challenges and potential pitfalls. Understanding these can help release engineers avoid common mistakes and make more informed decisions.
Overemphasis on Metrics Over Quality
Pitfall: Focusing solely on improving DORA metrics can lead to overlooking the overall quality of the software. Teams might rush changes to increase deployment frequency or reduce lead time, compromising the product’s robustness and security. This is a classic case of “Goodhart’s Law, which states that when a measure becomes a target, it ceases to be a good measure”.
Solution: Balance the focus on metrics with a commitment to maintaining high-quality standards. Implement thorough testing and code review processes to ensure quality is not sacrificed for speed.
Misinterpreting Metrics
Pitfall: DORA metrics can be misinterpreted without context. For example, a high deployment frequency might seem optimistic but could indicate frequent hotfixes for recurring issues, highlighting underlying problems rather than improvements.
Solution: Analyze metrics within the context of overall performance and other relevant data. Use complementary metrics and qualitative insights to view the team’s effectiveness comprehensively.
Neglecting Team Morale
Pitfall: Intense focus on improving DORA metrics can result in burnout and decreased morale among team members. Pushing for more frequent deployments or faster lead times without considering workload can negatively impact the team’s well-being.
Solution: Foster a healthy work environment by setting realistic goals and ensuring adequate support and resources for the team. Encourage open communication about workloads and stress levels.
Lack of Actionable Insights
Pitfall: Collecting and reporting DORA metrics without deriving actionable insights can lead to data without purpose. Teams might track metrics but fail to implement changes based on the findings.
Solution: Review and analyze DORA metrics regularly to identify trends and areas for improvement. Using the insights obtained from the metrics, develop and execute action plans.
Insufficient Tooling and Automation
Pitfall: Inadequate tooling and automation can hinder efforts to improve DORA metrics. Manual processes and outdated tools can slow down deployments and increase lead times.
Solution: Invest in modern CI/CD tools, automated testing frameworks, and infrastructure as code solutions. Continuously evaluate and update the toolchain to ensure it supports efficient workflows.
Frequently Asked Questions
Q1: What are DORA metrics?
DORA (DevOps Research and Assessment) metrics are essential performance indicators for evaluating the effectiveness of software delivery and operational practices. The four main DORA metrics are Deployment Frequency (DF), Lead Time for Change, Change Failure Rate, and Mean Time to Recovery (MTTR).
Q2: Why are DORA metrics important?
DORA metrics provide valuable insights into the performance and health of software delivery processes. They help identify bottlenecks, measure improvements, and drive continuous improvement in DevOps practices, leading to more efficient and reliable software delivery.
Q3: How often should I review and analyze DORA metrics?
Regularly review DORA metrics, ideally on a weekly or bi-weekly basis, to continuously monitor performance and identify areas for improvement. Use these reviews to inform decisions and drive ongoing enhancements in the software delivery process.
Q4: What tools can help improve DORA metrics?
- CI/CD Tools: Jenkins, GitHub Actions, GitLab CI, CircleCI
- Build Automation Tools: Maven, Gradle, Make, Ant
- Artifact Management: JFrog Artifactory, Nexus, AWS S3
- Configuration Management: HashiCorp Consul, Spring Cloud Config, AWS Parameter Store
- Monitoring and Logging: Prometheus, Grafana, New Relic, ELK Stack
Q5: How can I measure the current state of my DORA metrics?
- Deployment Frequency: Measure the number of deployments within a defined timeframe.
- Lead Time for Changes: Measure the time from code commit to production deployment.
- Change Failure Rate: Divide the number of failed deployments by the total deployments.
- Mean Time to Recovery: Track and average the time from incident detection to resolution.
Q6: What is release engineering?
Release engineering is a discipline within software development focused on the processes and practices for building, packaging, and delivering software efficiently and reliably. It involves coordinating various aspects of software creation, from source code management to deployment.