Top 8 KPIs for Release Management

What is Release Management?
Release management represents the organized methodology for planning software releases and their coordination, plus their controlling aspects. The release management system enables smooth deployment of updates together with new features and bug fixes that cause minimal system interruptions to users.
In the Software Development Lifecycle (SDLC), it covers stages like planning, building, testing, deploying, and monitoring. In this blog we are going to cover why KPIs are important and what are the top KPIs for Release Management.
Why Are KPIs Important in Release Management?
Release management effectiveness depends heavily on Key Performance Indicators (KPIs) to evaluate its performance correctly. The release process becomes measurable through them to identify specific problem areas for enhancement.
Benefits of Tracking KPIs:
- Identify bottlenecks and inefficiencies
- Improve release quality and reliability
- Reduce deployment failures and downtime
- Enhance collaboration between teams
In the next section, we’ll explore what are the major challenges in Release Management.
Major Challenges in Release Management
Despite its benefits, release management often faces several obstacles:
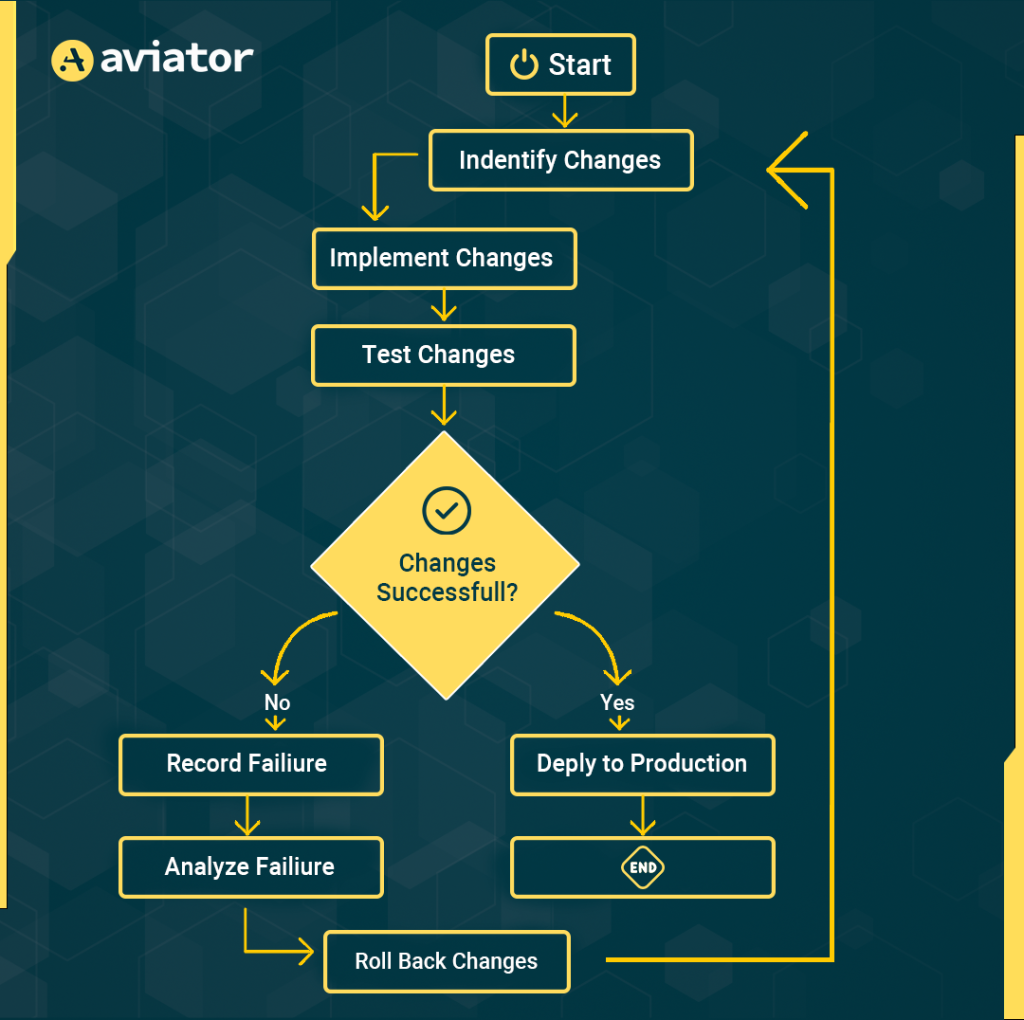
- Deployment Failures and Rollback: A CI/CD pipeline deployed a microservice using Kubernetes. After deployment, the service pods entered a CrashLoopBackOff state due to a missing env variable.
- Slow or Inconsistent Release Cycles: A monolithic application with slow build times (45+ minutes) caused deployment delays.
- Lack of Visibility into Release Performance: The team couldn’t track API response times or resource usage, leading to delayed issue detection.
- Inefficient Collaboration Between Teams: Development and operations teams used different tools for tracking incidents, causing misalignment.
Addressing these challenges requires a strategic approach with well-defined KPIs, which we will cover next.
Using KPIs in Release Management
Software release success and efficiency require Key Performance Indicators (KPIs) to measure their effectiveness. KPIs generate actionable insights that allows teams to locate problems during deployments and optimize operational procedures for increased deployment success.
Importance of KPIs in Release Management
- Track Success and Failures: KPIs provide organizations with straightforward data that reveals if product releases achieved their set goals.
- Optimize Processes: Teams can detect bottlenecks and inefficiencies for improvements.
- Enhance Collaboration: Using KPI for DevOps, development teams can collaborate effectively with operations and QA groups.
- Minimize Risks: Organizations can proactively reduce downtime by monitoring failure rates and recovery times.
Applying DORA and SPACE Frameworks for Effective KPI Management
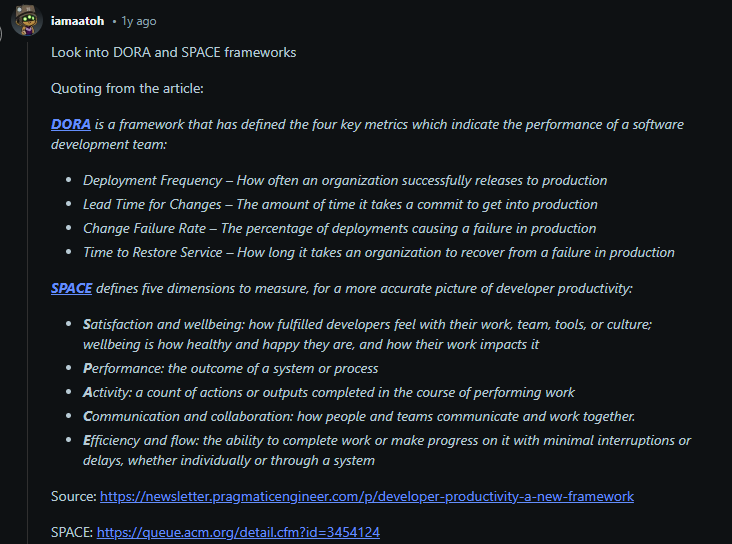
Organizations use the DORA and SPACE frameworks for assessing software development performance and related improvements. DORA Metrics for Release Management:
- The tracking of release deployment frequency provides important data to organizations. The delivery schedule shortens as the frequency increases.
- Lead Time for Changes represents the duration between developers making a code modification to the point of deployment. Efficient processes result from short lead time performance.
- The Change Failure Rate indicates the frequency at which deployments result in service failures. Strong testing and good code quality lead to lower values of CFR.
- Organizations can evaluate service recovery speed through Time to Restore Service (MTTR) measurements. Faster recovery reduces customer impact.
SPACE Metrics for Developer Productivity:
While DORA focuses on operational performance, SPACE assesses how developers and teams perform on a broader scale:
- Satisfaction and wellbeing monitors how content developers are with their work, tools, and overall workplace environment.
- Performance evaluates the outcomes and quality of code, ensuring that productivity leads to meaningful results.
- The tracking system monitors developmental assignments and deployment schedules alongside code modifications to determine total team participation.
- Communication and collaboration can help evaluate teamwork relationships to remove organizational silos while promoting smooth internal coordination.
- Work efficiency and flow evaluation determines the regular and smooth advancement of operations without encountering delays or obstacles.

The Impact of Data-Driven Release Management
When decisions are based on accurate data, teams can:
- Deliver releases faster and with higher quality.
- Predict and mitigate potential issues before they escalate.
- Improve customer satisfaction by reducing bugs and performance issues.
- Allocate resources more efficiently, focusing on areas that need attention.
Metrics to Avoid: Why Choosing the Right KPIs Matters?
Tracking performance indicators does not always lead to useful insights. ounting lines of code and commits doesn’t relly measure real success in release quality although they are commonly used as vanity metrics.
Teams should concentrate on KPIs that deliver tangible release performance results including deployment frequency, change failure rate and mean time to recovery. By selecting the right KPIs business can make data-driven decisions to achieveAs we have already gone through why choosing the right KPIs matter, let’s see what are the Top 8 KPIs for Release Management Metrics.
Top 8 KPIs for Release Management Metrics
Tracking key performance indicators (KPIs) is important for optimizing the release management process. Jenkins, as a leading CI/CD automation tool like Gitlab CI/CD, Github Actions, and CircleCI, provides powerful features to monitor and manage these metrics. Let’s explore the top 8 KPIs for release management and how Jenkins can help you track and improve them.
1. Deployment Frequency
Definition:
The system tracks production deployment frequencies of new code changes.
Relevance:
- High deployment frequency indicates a strong CI/CD pipeline.
- Frequent releases allow faster feedback and reduced risk.
Using Jenkins to Track and Improve:
You can set up a simple Jenkins pipeline, each dedicated to a microservice for automated deployments:
| pipeline { agent any environment { SERVICE_NAME = ‘payment-service’ // Example: Payment Service DEPLOY_SCRIPT = “./deploy-${SERVICE_NAME}.sh” } stages { stage(‘Build’) { steps { sh “mvn clean package -Dservice=${SERVICE_NAME}” } } stage(‘Deploy’) { steps { sh “${DEPLOY_SCRIPT}” } } } post { success { echo “${SERVICE_NAME} deployed successfully!” } failure { echo “Deployment failed for ${SERVICE_NAME}. Check logs for details.” } } } |
Tip: Integrate plugins like Build Pipeline Plugin or Prometheus Plugin to visualize and monitor deployment frequency.
2. Lead Time for Changes
Definition:
Tracks the time from code commit to deployment in production. Lead time was categorized as:
- Elite: Less than one day
- High: Between one day and one week
- Medium: Between one week and one month
- Low: Between one month and size months
Relevance:
- Shorter lead time means faster feedback and quicker releases.
- Helps identify delays in the CI/CD pipeline.
Using Jenkins to Track and Reduce:
You can calculate lead time using commit timestamps:
| pipeline { agent any environment { COMMIT_TIME = sh(script: “git show -s –format=%ct HEAD”, returnStdout: true).trim() } stages { stage(‘Build’) { steps { sh ‘mvn clean package’ } } stage(‘Deploy’) { steps { sh ‘./deploy.sh’ } } } post { success { def currentTime = System.currentTimeMillis() / 1000 def leadTime = currentTime – COMMIT_TIME.toLong() echo “Lead Time for Changes: ${leadTime / 60} minutes” } } } |
Tip: Use Jenkins Blue Ocean to monitor pipeline durations and detect bottlenecks.
3. Change Failure Rate (CFR)
Definition:
Measures the percentage of deployments that lead to failures or rollbacks.

Relevance:
- A low CFR indicates reliable releases.
- Reduces downtime and user impact.
Using Jenkins to Monitor and Reduce CFR:
Track failures and trigger alerts using post-build actions:
| pipeline { agent any stages { stage(‘Build’) { steps { sh ‘mvn clean package’ } } stage(‘Deploy’) { steps { sh ‘./deploy.sh’ } } } post { success { echo ‘Deployment Successful’ } failure { echo ‘Deployment Failed. Incrementing Failure Counter’ sh ‘curl -X POST http://localhost:9090/api/v1/counter/increment’ } } } |
Tip: Integrate with Prometheus and Grafana for live tracking of failures.
4. Mean Time to Recovery (MTTR)
Definition:
Tracks the average time to recover from a failed deployment.
Formulae to calculate MTTR:

Where:
Total Downtime = The cumulative duration of all incidents
Number of Incidents = Total number of incidents in the measured period
Relevance:
- Lower MTTR reduces downtime and business impact.
- Effective monitoring improves incident response.
Using Jenkins to Automate Recovery:
Set up automated rollbacks with Jenkins conditional stages:
| pipeline { agent any environment { DEPLOY_STATUS = ” } stages { stage(‘Deploy’) { steps { script { try { sh ‘./deploy.sh’ DEPLOY_STATUS = ‘SUCCESS’ } catch (Exception e) { DEPLOY_STATUS = ‘FAILED’ } } } } stage(‘Rollback’) { when { expression { DEPLOY_STATUS == ‘FAILED’ } } steps { echo ‘Deployment failed. Initiating rollback…’ sh ‘./rollback.sh’ } } } } |
Tip: Pair Jenkins with monitoring tools like Grafana to visualize MTTR trends.
5. Release Downtime and Stability
Definition:
Release Downtime and Stability metric measures the uptime vs downtime after a release, estimating how stable your application will be post-deployment.
Relevance:
- Minimized downtime ensures customer satisfaction.
- Stability indicates successful releases and robust testing.
Using Jenkins to Track and Improve Stability:
Jenkins can monitor post-release stability using automated health checks. Here’s an example of a simple pipeline that runs a health check:
| pipeline { agent any stages { stage(‘Deploy’) { steps { sh ‘./deploy.sh’ } } stage(‘Health Check’) { steps { script { def status = sh(script: ‘./health_check.sh’, returnStatus: true) if (status != 0) { error ‘Health check failed. Possible downtime detected.’ } else { echo ‘Health check passed. Release is stable.’ } } } } } } |
Tip: Integrate Jenkins with monitoring tools like Prometheus to track uptime.
6. Customer Impact Metrics
Definition:
Tracks user-reported issues and application performance metrics to measure the real-world impact of releases.
Relevance:
- Helps identify whether a release has negatively impacted users.
- Ensures quick resolution of user-facing problems.
Using Jenkins to Track Customer Impact:
You can automate the collection of customer feedback using API calls and Jenkins post-build actions:
| pipeline { agent any stages { stage(‘Deploy’) { steps { sh ‘./deploy.sh’ } } } post { success { echo ‘Deployment Successful’ sh ‘curl -X GET http://monitoring-service/api/user-feedback’ } failure { echo ‘Deployment Failed. Monitoring for user complaints…’ } } } |
Tip: Combine this with A/B testing by deploying different versions of the application and comparing user feedback using Jenkins Multibranch Pipelines.
7. Percentage of Automated vs. Manual Releases
Definition:
This metric compares how many releases are automated versus manual. Higher automation rates reduce errors and improve consistency.
Relevance:
- Automation accelerates release cycles.
- Minimizes human error.
Using Jenkins to Track and Increase Automation:
Jenkins pipelines can be configured to track automated and manual releases using environment variables:
| pipeline { agent any environment { RELEASE_TYPE = ‘Automated’ // Change to ‘Manual’ if needed } stages { stage(‘Build’) { steps { sh ‘mvn clean package’ } } stage(‘Deploy’) { steps { sh ‘./deploy.sh’ } } } post { success { echo “Release Type: ${RELEASE_TYPE}” sh “curl -X POST http://metrics-service/api/releases -d ‘type=${RELEASE_TYPE}'” } } } |
Tip: Jenkins plugins like Pipeline Maven Integration and Prometheus Plugin can help visualize automated vs. manual release trends.
8. Rollback Rate
Definition:
Tracks the percentage of releases that require rollback due to issues.
Relevance:
- A high rollback rate indicates poor testing or insufficient pre-release validation.
- Effective rollback management reduces downtime and user impact.
Using Jenkins to Manage Rollbacks:
Implement a rollback strategy using Jenkins pipelines with conditional rollbacks:
| pipeline { agent any environment { DEPLOY_STATUS = ” } stages { stage(‘Deploy’) { steps { script { try { sh ‘./deploy.sh’ DEPLOY_STATUS = ‘SUCCESS’ } catch (Exception e) { DEPLOY_STATUS = ‘FAILED’ } } } } stage(‘Rollback’) { when { expression { DEPLOY_STATUS == ‘FAILED’ } } steps { echo ‘Deployment failed. Initiating rollback…’ sh ‘./rollback.sh’ } } } } |
Tip: Implement Blue-Green Deployments using Jenkins for fewer rollbacks. Tools like ArgoCD can also be integrated for advanced deployment management.
Tools and Best Practices for Tracking KPIs in Release Management
Release management best practices rely on using the right tools effectively. Jenkins, along with the other tools, can help teams track KPIs, gain actionable insights, and optimize the software delivery process.
1. Choosing the Right Tools
To monitor and manage KPIs effectively, you need specialized tools across three main categories:
- Monitoring and Observability:
- Prometheus and Grafana: You can track Devops KPIs metrics like deployment frequency, MTTR, and CFR using customizable dashboards.
- Datadog and New Relic: They both can provide end-to-end observability with real-time alerts and incident tracking.
- CI/CD Automation:
- Jenkins: Automate builds, tests, and deployments with pipelines and monitor key release metrics.
- GitHub Actions and GitLab CI/CD: Support seamless integration and delivery with native automation features.
- Incident Management:
- PagerDuty and Opsgenie: Manage on-call notifications and incident escalations to reduce MTTR.
Example:
Jenkins can trigger alerts through Prometheus and integrate with PagerDuty to escalate issues:
| pipeline { agent any stages { stage(‘Deploy’) { steps { sh ‘./deploy.sh’ } } } post { failure { echo ‘Deployment failed. Sending alert to PagerDuty…’ sh ‘curl -X POST -H “Authorization: Token YOUR_TOKEN” https://api.pagerduty.com/incidents’ } } } |
2. Implementing Data-Driven Release Management
Data-driven decisions ensure a transparent and optimized release process. Jenkins can facilitate real-time tracking and automate reports.
1. Setting Up Dashboards:
- Integrate Jenkins with Grafana or Datadog for real-time visualization of KPIs.
- Use the Prometheus Plugin to export Jenkins build metrics.
2. Automating Reports:
You can generate automated reports post-release using Jenkins pipelines:
| pipeline { agent any stages { stage(‘Deploy’) { steps { sh ‘./deploy.sh’ } } } post { success { echo ‘Generating deployment report…’ sh ‘./generate_report.sh’ } } } |
Tip: Schedule Jenkins jobs to send periodic reports to DevOps or engineering teams using plugins like Email Extension Plugin.
3. Aligning KPIs with Business Goals
Aligning technical KPIs with business objectives helps translate engineering success into tangible business outcomes.
How KPIs Translate to Business Success:
- Deployment Frequency: Faster releases mean quicker feature delivery and a competitive edge.
- MTTR: Faster recovery reduces downtime, leading to better user satisfaction.
- CFR: Lower failure rates reflect higher software reliability.
Continuous Improvement Strategies:
- Analyze KPI trends using Jenkins reports and Grafana Dashboards.
- Conduct post-mortem analysis using Jenkins logs to identify areas for improvement.
- Implement feedback loops by automating feedback collection from users and integrating it into release planning.
Example:
Visualizing deployment success over time using Prometheus and Grafana:
| scrape_configs: – job_name: ‘jenkins’ static_configs: – targets: [‘localhost:9090’] |
This configuration will monitor Jenkins metrics and display insights on a Grafana dashboard.
Conclusion
Managing the right set of KPIs helps organizations to operate a dependable and effective software delivery process. Jenkins combines with Prometheus and Grafana along with PagerDuty, to provide continuous monitoring functions for these metrics. The combination of KPIs including Deployment Frequency together with Lead Time for Changes and Change Failure Rate (CFR) alongside MTTR allows you to achieve better releases and minimize downtime while improving user satisfaction.
Continuous monitoring and automated reporting and incident management services make releases easier to detect and resolve challenges in real time. These performance indicators when dedicated to business goals generate specific actionable insights which help both technical operations and organizational success.
Frequently Asked Questions (FAQs)
1. What Is the Most Critical KPI for Release Management?
Your goals determine which KPI is the most vital one. To ensure system stability and reliability, the two essential performance indicators are Change Failure Rate (CFR) and MTTR. The combination of Lead Time for Changes with Deployment Frequency becomes essential when the speed of market entry is the main goal.
2. What Are the 5 KPIs of Release Management?
The top 5 commonly used KPIs include:
- The frequency at which organizations execute their releases.
- Time from code commit to production.
- The percentage of deployments that fail (CFR).
- Time taken to recover from failures (MTTR)
- Stable Release Duration together with Post-Release Uptime.
3. What Is a Release Management Checklist?
A typical release management checklist includes:
- Code review completion
- CI/CD pipeline execution
- Automated testing verification
- Release notes and documentation updates
- Incident management readiness
- Post-release monitoring setup
4. How To Measure the Quality of a Release?
The quality assessment of a software release requires evaluation through defect rate measurements, defect density and severity along with defect resolution time, code coverage, user satisfaction and additional agile metrics of lead and cycle time.


