Managing Prometheus alerts in Kubernetes at scale using GitOps
In this post, we will look at how to manage Prometheus alerts in a GitOps way using the Prometheus Operator, Helm template, and ArgoCD.

Prometheus is a popular open-source monitoring and alerting solution. It is widely used in the Kubernetes ecosystem and is a part of the Cloud Native Computing Foundation.
Prometheus has a powerful alerting mechanism that allows users to define alerts based on the metrics collected by Prometheus. The alerts can be configured to send notifications to various channels like Slack, PagerDuty, Email, etc.
Managing Prometheus alerts can be a challenge in a large-scale Kubernetes environment as the number of alerts can grow. In this post, we will look at how to manage Prometheus alerts in a GitOps way using the Prometheus Operator, Helm template, and ArgoCD.

Prerequisites
- Kubernetes cluster
- Helm 3
- ArgoCD
Prometheus Operator
The Prometheus Operator provides Kubernetes native deployment and management of Prometheus Alert Rules. Let’s look at how to deploy Prometheus Operator using Helm.
Let’s install the Prometheus Operator using Helm. We will install Kube-Prometheus-Stack which includes Prometheus Operator, Prometheus, Grafana, Alertmanager, and other metrics exporters.
helm repo add prometheus-community https://prometheus-community.github.io/helm-charts
helm install my-kube-prometheus-stack prometheus-community/kube-prometheus-stack
This installs the CRD PrometheusRule which is used to define Prometheus alerts. Let’s look at an example PrometheusRule.
apiVersion: monitoring.coreos.com/v1
kind: PrometheusRule
metadata:
  annotations:
    meta.helm.sh/release-name: kube-prometheus-stack
  labels:
    app.kubernetes.io/instance: kube-prometheus-stack
    app.kubernetes.io/managed-by: Helm
  name: kubernetes-apps
spec:
  groups:
  - name: kubernetes-apps
    rules:
    - alert: KubePodCrashLooping
      annotations:
        description: 'Pod {{ $labels.namespace }}/{{ $labels.pod }} ({{ $labels.container
          }}) is in waiting state (reason: "CrashLoopBackOff").'
        runbook_url: https://runbooks.prometheus-operator.dev/runbooks/kubernetes/kubepodcrashlooping
        summary: Pod is crash looping.
      expr: max_over_time(kube_pod_container_status_waiting_reason{reason="CrashLoopBackOff",
        job="kube-state-metrics", namespace=~".*"}[5m]) >= 1
      for: 15m
      labels:
        severity: warning
The above PrometheusRule defines an alert KubePodCrashLooping which is triggered when a pod is in CrashLoopBackOff state for more than 15 minutes.
Now, if you have a large number of alerts the file grows and is not very readable once you have more than 5 alerts. If you have multiple teams that have their own set of alerts, managing can be a challenge. Let’s look at how to manage Prometheus alerts in a GitOps way using Helm template and ArgoCD.
Example
We have two teams that have their own set of alerts. One could have a single file with all the alerts defined in it, but readability takes a hit there and it would all be under a single resource.
Instead, let’s create a helm template to parse the alerts defined in each team’s folder and create a PrometheusRule resource for each of them.
Below is the directory structure we’ll follow :
├── alert-rules
│   ├── Chart.yaml
│   ├── alert-rules
│   │   ├── Team-A
│   │   │   └── health_alerts.yaml
│   │   └── Team-B
│   │       └── latency_alerts.yaml
│   └── values.yaml
│   └── templates
│       └── prometheusRule.yaml
Now let’s create the helm template templates/prometheusRule.yaml and paste the below content.
{{- /*
Define a PrometheusRule object for each rule file.
*/ -}}
{{- $ruleValues := .Values.ruleValues }}

{{- /*
Iterate over each rule file and create a PrometheusRule object with appropriate annotations and labels.
*/ -}}

{{- range $ruleFolderPath := .Values.rulePaths }}
  {{- range $path, $_ := trimSuffix "/" $ruleFolderPath | printf "%s/**/**.yaml" | $.Files.Glob  }}
    {{- $team := dir $path | base }}
    {{- $ruleName := base $path | trimSuffix ".yaml" | printf "%s-%s" $team | kebabcase}}
    {{- if and (get $.Values.createRules $team) (base $path | ne ".defaults.yaml") }}
      {{- $template := $.Files.Get $path | fromYaml }}
      {{- if not $template.rules }}
        {{- cat ".rules is not defined in" $path | fail }}
      {{- end }}
      {{- $defaults := dir $path | printf "%s/.defaults.yaml" | $.Files.Get | fromYaml }}
      {{- $defaultAnnotations := get $defaults "annotations" | default (dict) }}
      {{- $defaultLabels := get $defaults "labels" | default (dict) }}
---
apiVersion: monitoring.coreos.com/v1
kind: PrometheusRule
metadata:
  name: {{ kebabcase $ruleName | quote }}
spec:
  groups:
  - name: {{ camelcase $team | quote }}
    rules:
      {{- range $_, $rule := $template.rules }}
      {{- $rule = mergeOverwrite (dict "annotations" (dict) "labels" (dict)) $rule }}
      {{- $tplDict := dict "Values" $ruleValues "Template" $.Template "Rule" $rule }}
      {{- $_ := tpl $rule.name $tplDict | set $rule "name" }}
    - alert: {{ quote $rule.name }}
      annotations:
        {{- $annotations := merge $rule.annotations $defaultAnnotations }}
        {{- range $key, $rawValue := $annotations }}
          {{- $templatedValue := tpl $rawValue $tplDict }}
          {{- with $templatedValue }}
            {{- dict $key $templatedValue | toYaml | nindent 8 }}
          {{- end }}
        {{- end }}
      expr: |-
        {{- tpl $rule.expr $tplDict | nindent 8 }}
      for: {{ $rule.for | default $ruleValues.defaults.for }}
      labels:
        {{- $labels := merge $rule.labels $defaultLabels }}
        {{- range $key, $rawValue := $labels }}
          {{- $templatedValue := tpl $rawValue $tplDict }}
          {{- with $templatedValue }}
            {{- dict $key $templatedValue | toYaml | nindent 8 }}
          {{- end }}
        {{- end }}
      {{- end }}
    {{- end }}
  {{- end }}
{{- end }}
Understanding the template
Let’s go through the above template to understand how it works :
- The template iterates over each directory defined in the
rulePathsvalue and iterates over each.yamlfile in the directory.{{- range $ruleFolderPath := .Values.rulePaths }} {{- range $path, $_ := trimSuffix "/" $ruleFolderPath | printf "%s/**/**.yaml" | $.Files.Glob }} - We define the
$teamvariable which is the name of the directory andruleNamevariable which is the name of the rule file.{{- $team := dir $path | base }} {{- $ruleName := base $path | trimSuffix ".yaml" | printf "%s-%s" $team | kebabcase}} - Next, we define the $template variable which is the content of the rule file and not iterated over
.defaults.yamlfile. From the last step,$pathis the path of the rule file and then we use thefromYamlfunction to convert the content of the YAML to object so that we can iterate over it later.
{{- if (base $path | ne ".defaults.yaml") }}
{{- $template := $.Files.Get $path | fromYaml }}- Then we assign the
$defaultsvariable which is the content of the.defaults.yamlfile and then create two variables$defaultAnnotationsand$defaultLabelswhich are the annotations and labels defined in the.defaults.yamlfile. - Next, we iterate over each rule defined and create an empty dictionary for annotations and labels. This ensures that each alert has annotations and labels defined. Further, we create a template dictionary which is used to pass the values to the template.
- The template dictionary has three keys
Values,Template, andRule. TheValueskey is used to pass the values defined in thevalues.yamlfile. TheTemplatekey is used to pass the template object, which is the content of the rule file. ThisRuleis used to pass the rule object which is the content of the rule file.
{{- range $_, $rule := $template.rules }}
{{- $rule = mergeOverwrite (dict "annotations" (dict) "labels" (dict)) $rule }}
{{- $tplDict := dict "Values" $ruleValues "Template" $.Template "Rule" $rule }}
{{- $_ := tpl $rule.name $tplDict | set $rule "name" }}- Then we define the annotations section of the alert, where we merge the annotations defined in each rule and the annotations defined in
.defaults.yamlfile. - Next, we iterate over each annotation and template the value using the
tplfunction, which takes the value and the template dictionary as input and returns the templated value. This is needed because we want to pass the values defined in thevalues.yamlfile to the template. Once you’ll see thevalues.yaml, it will be more clear. - Finally, we create a dictionary with the key as the annotation name and the value as the templated value and then convert it to YAML and indent it by 8 spaces.
{{- $annotations := merge $rule.annotations $defaultAnnotations }}
{{- range $key, $rawValue := $annotations }}
  {{- $templatedValue := tpl $rawValue $tplDict }}
  {{- with $templatedValue }}
    {{- dict $key $templatedValue | toYaml | nindent 8 }}
  {{- end }}
{{- end }}- The same is done for other sections like
expr,for, andlabels.
Let’s look at the alert-rules/values.yaml file.
# Path to directory with rules files of teams
rulePaths:
  - alert-rules

# Enable / disable rules creation for teams
createRules:
  Team-A: true
  Team-B: false

# ruleValues that will be referred as .Values.ruleValues in rule definitions
ruleValues:
  defaults:
    for: 60s
  severity:
    critical: critical
    warning: warning
It’s time to take a look at a sample alert definition file, let’s look at the Team-A/health_alerts.yaml file.
rules:
  - name: KubeContainerWaiting
    expr: sum by (namespace, pod, container, cluster) (kube_pod_container_status_waiting_reason{job="kube-state-metrics",
        namespace=~"team-a"}) > 0
    for: 1h
    labels:
      severity: '{{ .Values.severity.critical }}'
    annotations:
      description: 'Pod {{ "{{$labels.namespace}}" }}/{{ "{{$labels.pod}}" }} has been in waiting state for more than 1 hour.'
      summary: 'Pod container waiting longer than 1 hour.'
Since rules is a list, you can define multiple alerts in a single file. Suggested to separate alerts by category like health, latency, etc. in different files.
Let’s also take a look at Team-A/.defaults.yaml file.
annotations:
  summary: '{{ .Rule.name }}'
labels:
  team: Team-A
Now that we have everything, let’s run Helm template and see what it generates.
---
# Source: alerts/templates/prometheusRule.yaml
apiVersion: monitoring.coreos.com/v1
kind: PrometheusRule
metadata:
  name: "team-a-health-alerts"
  labels:
    app.kubernetes.io/instance: alert-rules
    app.kubernetes.io/managed-by: Helm
spec:
  groups:
  - name: "TeamA"
    rules:
    - alert: "KubeContainerWaiting"
      annotations:
        description: Pod {{$labels.namespace}}/{{$labels.pod}} has been in waiting state for
          more than 1 hour.
        summary: Pod container waiting longer than 1 hour.
      expr: |-
        sum by (namespace, pod, container, cluster) (kube_pod_container_status_waiting_reason{job="kube-state-metrics", namespace=~"team-a"}) > 0
      for: 1h
      labels:
        severity: critical
        team: Team-A
Recall that I mentioned that we need the tpl function to pass the values defined in the values.yaml file to the template. If you see the above output, you’ll see that the severity value is replaced with the value defined in the values.yaml file.
You can also see that team label is added to each alert where the value is defined in the .defaults.yaml file. It’s just an example, you can add any custom label that you want to see in each alert from that team for example environment, tenant, etc.
Now, let’s deploy the alerts using ArgoCD by creating an application.
apiVersion: argoproj.io/v1alpha1
kind: Application
metadata:
  name: alert-rules-lab-cluster
  namespace: argocd
spec:
  destination:
    server: "https://kubernetes.default.svc"
    namespace: monitoring
  source:
    path: alert-rules
    repoURL: git@github.com:tanmay-bhat/prometheus-alerts-demo.git
    targetRevision: master
    helm:
      valueFiles:
      - values.yaml
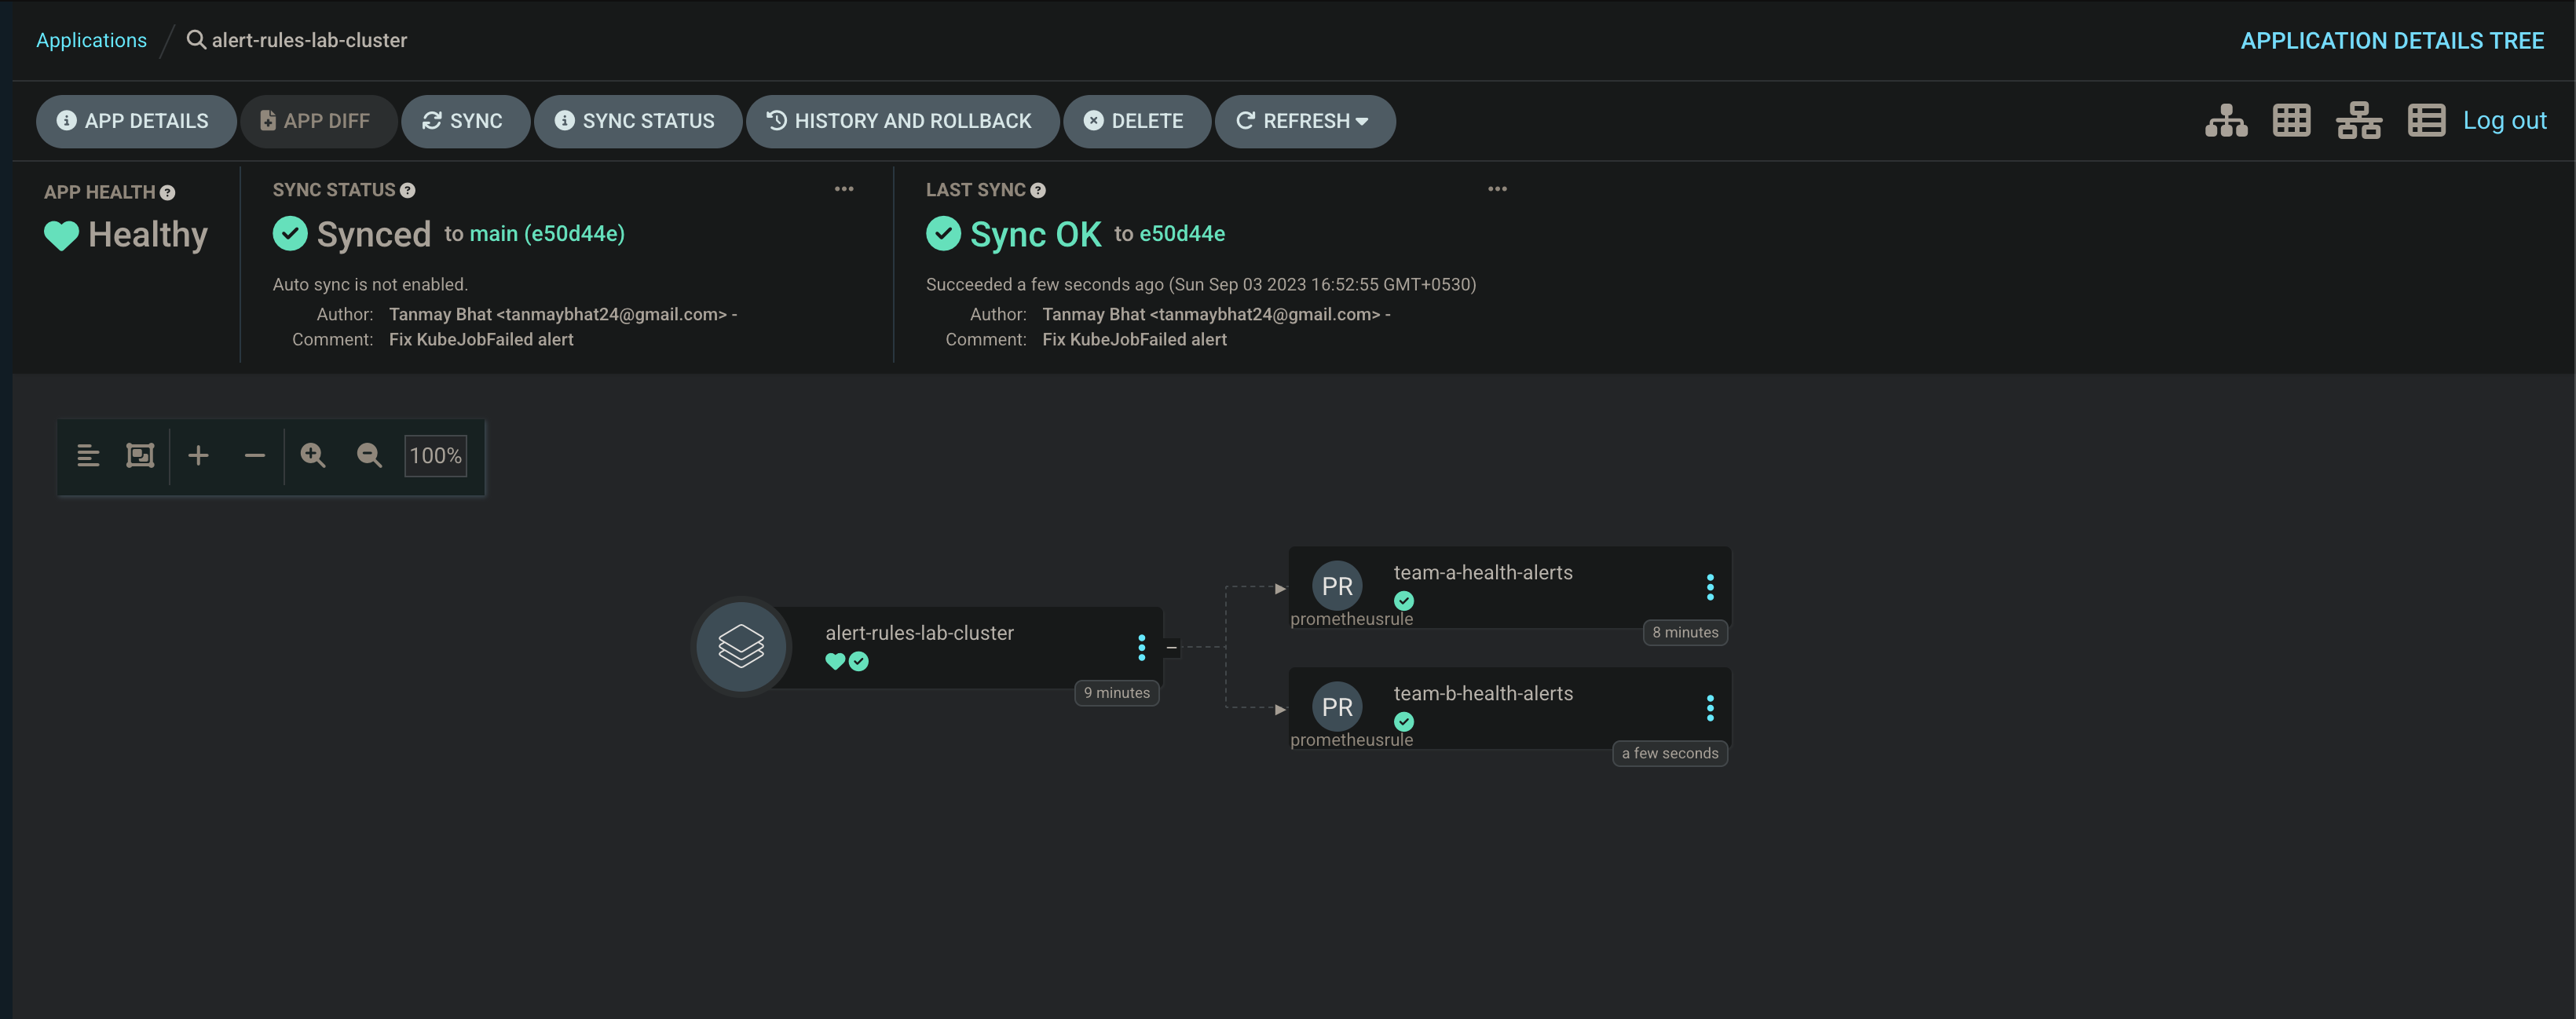
Once the application is deployed, you can see the Alerts managed in the Prometheus UI.
Benefits of managing alerts in a GitOps way
- Since each team has its own directory and rules file per category, its easy to manage once the organization grows.
- Readability is better as compared to a single file with all the alerts defined in it.
- Alerts cannot be deleted by mistake and cannot be manually edited, which ensures what you write is what you get.
- Bulk changes to alerts can be done easily by editing the template.
- Adding a new label, annotation, or even updating severity value for all alerts is flexible since its template-based.
- You can easily enable or disable alerts for a team per environment.
References
https://helm.sh/docs/chart_template_guide/function_list/
https://prometheus-operator.dev/docs/api-reference/api/
https://github.com/tanmay-bhat/prometheus-alerts-demo
Aviator: Automate your cumbersome processes
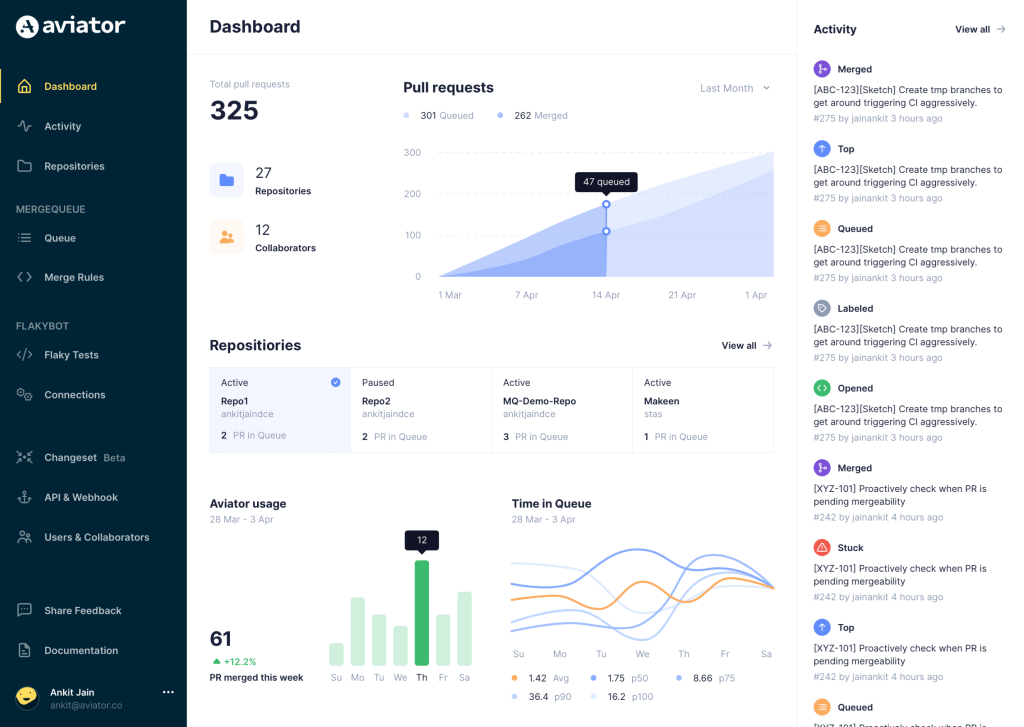
Aviator automates tedious developer workflows by managing git Pull Requests (PRs) and continuous integration test (CI) runs to help your team avoid broken builds, streamline cumbersome merge processes, manage cross-PR dependencies, and handle flaky tests while maintaining their security compliance.
There are 4 key components to Aviator:
- MergeQueue – an automated queue that manages the merging workflow for your GitHub repository to help protect important branches from broken builds. The Aviator bot uses GitHub Labels to identify Pull Requests (PRs) that are ready to be merged, validates CI checks, processes semantic conflicts, and merges the PRs automatically.
- ChangeSets – workflows to synchronize validating and merging multiple PRs within the same repository or multiple repositories. Useful when your team often sees groups of related PRs that need to be merged together, or otherwise treated as a single broader unit of change.
- TestDeck – a tool to automatically detect, take action on, and process results from flaky tests in your CI infrastructure.
- Stacked PRs CLI – a command line tool that helps developers manage cross-PR dependencies. This tool also automates syncing and merging of stacked PRs. Useful when your team wants to promote a culture of smaller, incremental PRs instead of large changes, or when your workflows involve keeping multiple, dependent PRs in sync.


